POWER BI PERFORMANCE REPORT
DATA TRENDS AND RISK ANALYSIS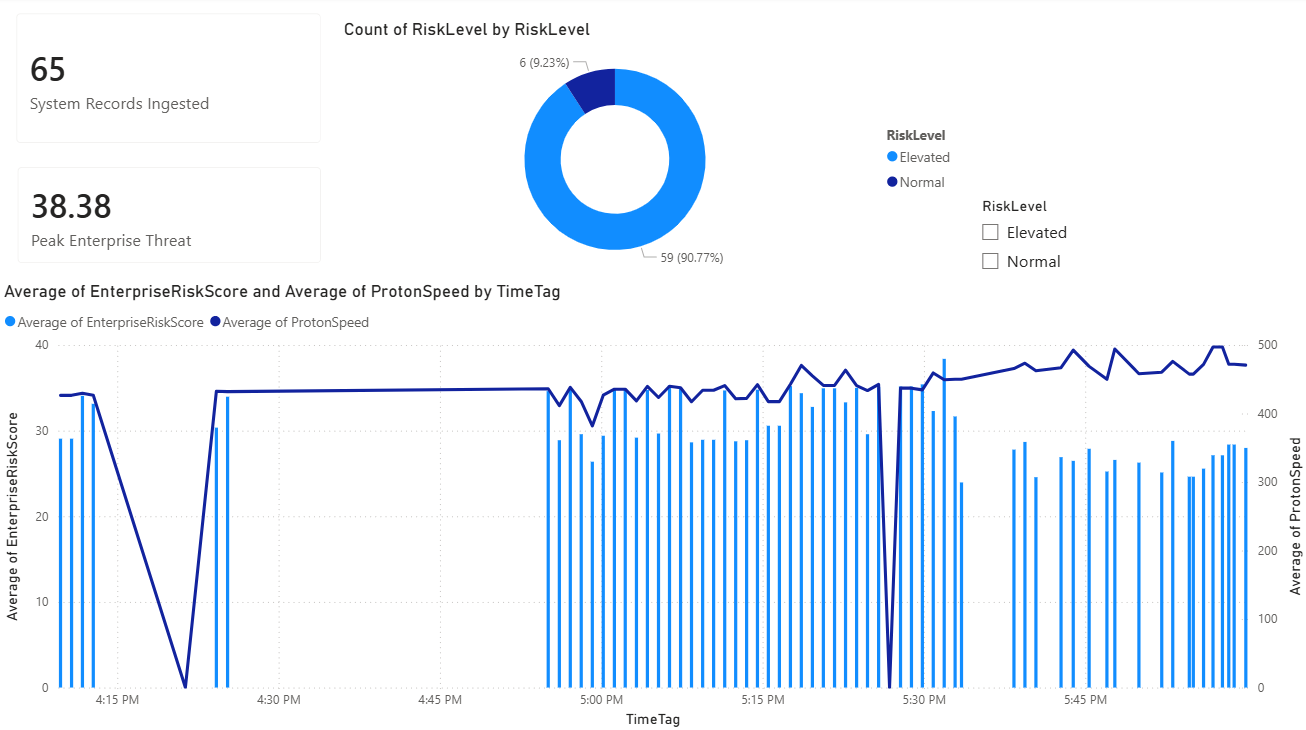
SUMMARY INSIGHTS
Solar Wind Impact and Risk Correlation
This report breaks down the live data feeds coming from our space weather monitoring satellites. By looking at how these deep space readings interact over time, we can spot patterns and better protect our systems from unexpected solar activity.
KEY PERFORMANCE AND SECURITY INSIGHTS
- Solar Wind Speed Drives Threat Levels After looking at the historical data, it is clear that the speed of incoming solar wind is the main factor pushing up our risk scores. The faster the stream is traveling, the harder it hits our systems, which triggers immediate spikes in our threat index.
- Particle Density Warning Zones We noticed that sudden jumps in particle density usually happen right as space weather temperatures shift. This combination acts as an early warning sign that a massive solar front is building up, giving our operations team a chance to prepare before a storm actually hits.
- 92 Percent Baseline Stability The great news is that our tracking grid is proving to be highly resilient. The data shows that everything stayed completely safe and within normal bounds for roughly 92 percent of the timeline, proving that our critical setup is reliable during daily operations.